FIELD: medicine.
SUBSTANCE: blood microcirculation speed indicators are registered through laser Doppler ultrasonic flowmetering. Spectral analysis of resulted flowgram is carried out by continuous wavelet transform including evaluation of cardio-timing frequency power a at time point b by formula  , where W (a, b) - wavelet transform factor; f (t) - analysed function; ψ(((t-b)/a)-analysed wavelet. Scaling pattern is drawn up based on scaling wavelet factor within segment [bi, bj] by formula
 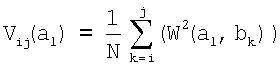 , where i, j<N, j>i, V (al) - scaling pattern signal; N - number of factors; al - wavelet transform scale. Physiologically significant frequency ranges are marked on scaling patterns as distances between adjacent local minima on scaling curve by formula: Δa = am - an, where Δa - physiologically significant range, am, an - adjacent local minima on scaling curve. Wavelet power density values U are evaluated for each frequency range Δa = [am, an] by formula
 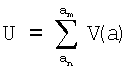 , then time variation of wavelet power density is calculated as U (t); and time variation of frequency ranges are detected as Δa (t). Specific wavelet power density values U ' by time is given by: U ' = U (t) / Δa (t).
EFFECT: increased informativity and accuracy of human microcirculation channel regulation analysis.
2 dwg, 1 ex
| Title | Year | Author | Number |
|---|---|---|---|
| METHOD OF HUMAN HEART RATE VARIABILITY EXAMINATION | 2007 |
|
RU2326587C1 |
| METHOD OF HUMAN AND ANIMAL ENCEPHALOGRAM EXAMINATION | 2007 |
|
RU2332160C1 |
| METHOD FOR STUDYING DAILY MONITORING CURVES OF HUMAN BLOOD PRESSURE | 2010 |
|
RU2465822C2 |
| METHOD FOR STUDYING AUTONOMIC REGULATION OF MICROCIRCULATION TRACT IN NEONATALS | 2006 |
|
RU2308222C1 |
| METHOD FOR STUDYING HUMAN'S AND ANIMAL'S ELECTROENCEPHALOGRAMS | 2012 |
|
RU2543275C2 |
| METHOD FOR STUDYING CARDIAC RHYTHM VARIABILITY IN CHILDREN | 2003 |
|
RU2241374C2 |
| METHOD FOR RECORDING BLOOD MICROCIRCULATION | 2008 |
|
RU2390306C1 |
| METHOD FOR COMPLEX ASSESSMENT OF ARTERIAL BED STATE | 2019 |
|
RU2731414C1 |
| METHOD OF ANALYSIS OF HEART RHYTHM VARIABILITY | 2007 |
|
RU2356495C1 |
| METHOD FOR DIAGNOSING PERIPHERAL BLOOD FLOW DISORDERS IN DIABETES MELLITUS | 2023 |
|
RU2822726C1 |

